See every workflow run
as it happens, end to end
Live status for every running workflow, step by step logs, full error diagnostics, per step timing, and a visual timeline.
From a running workflow to a fully understood one in 4 steps
Watch every run live, read the step by step log, diagnose errors inline, and profile on a timeline.
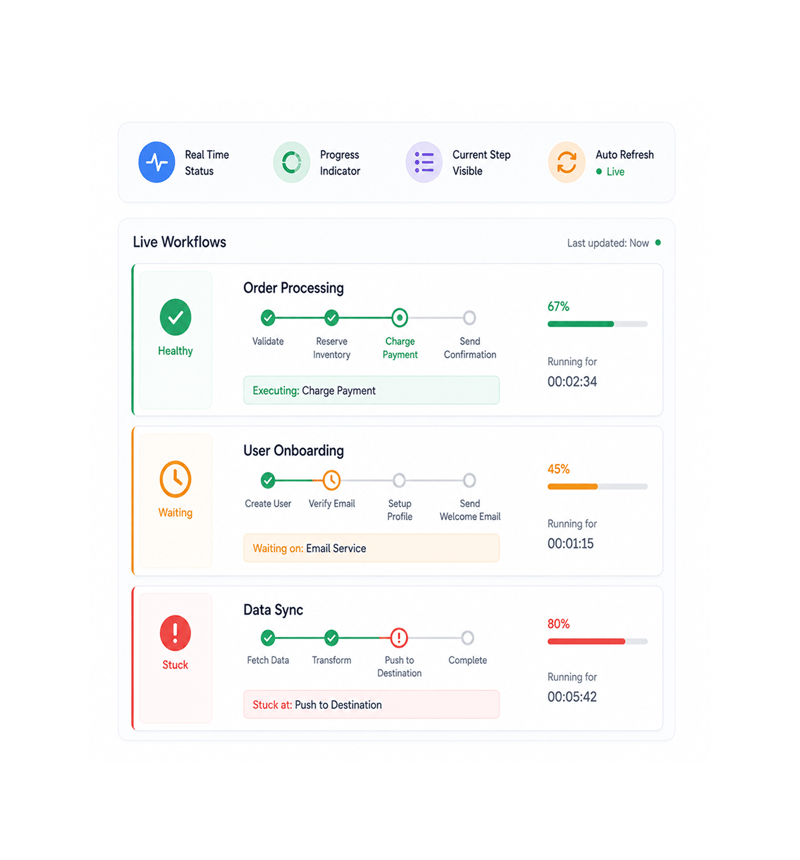
Live Status
Watch workflows run live
Open the execution view and every running workflow appears with a real time progress indicator showing which step is executing, how far through it is, and how long it has run. The team sees at a glance what is healthy or stuck.
- Real Time Status
- Progress Indicator
- Current Step Visible
- Auto Refresh
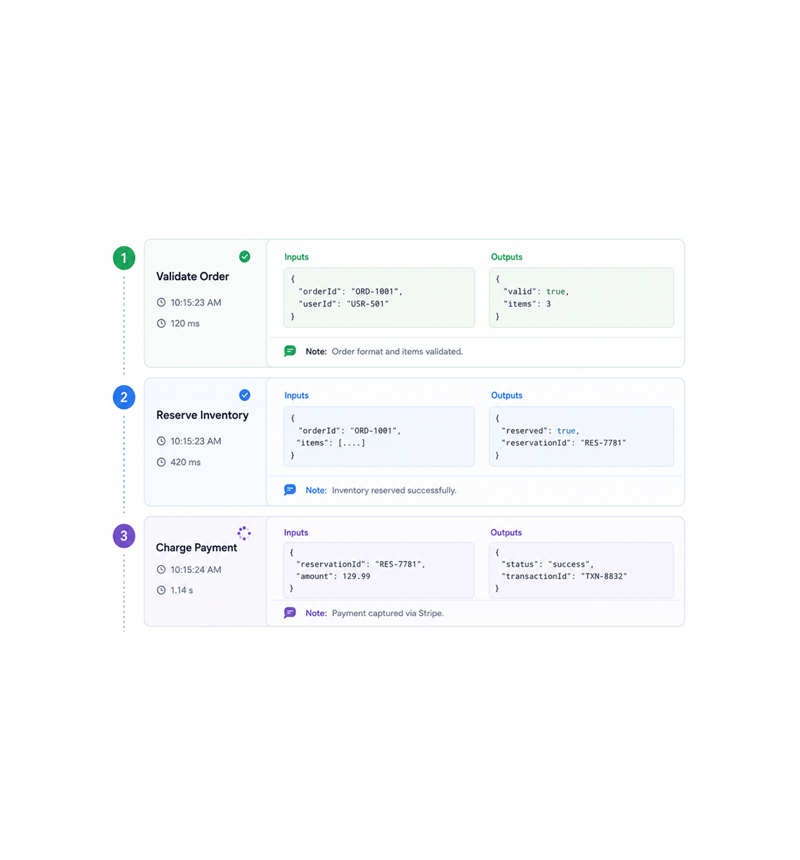
Step by Step Logs
Read step by step logs in order
Click into any run and the full step by step log opens with every step that executed, the inputs received, outputs produced, timing, and any notes. The log reads top to bottom in execution order, so understanding it is just reading.
- Every Step Logged
- Inputs & Outputs
- Execution Order
- Inline Notes
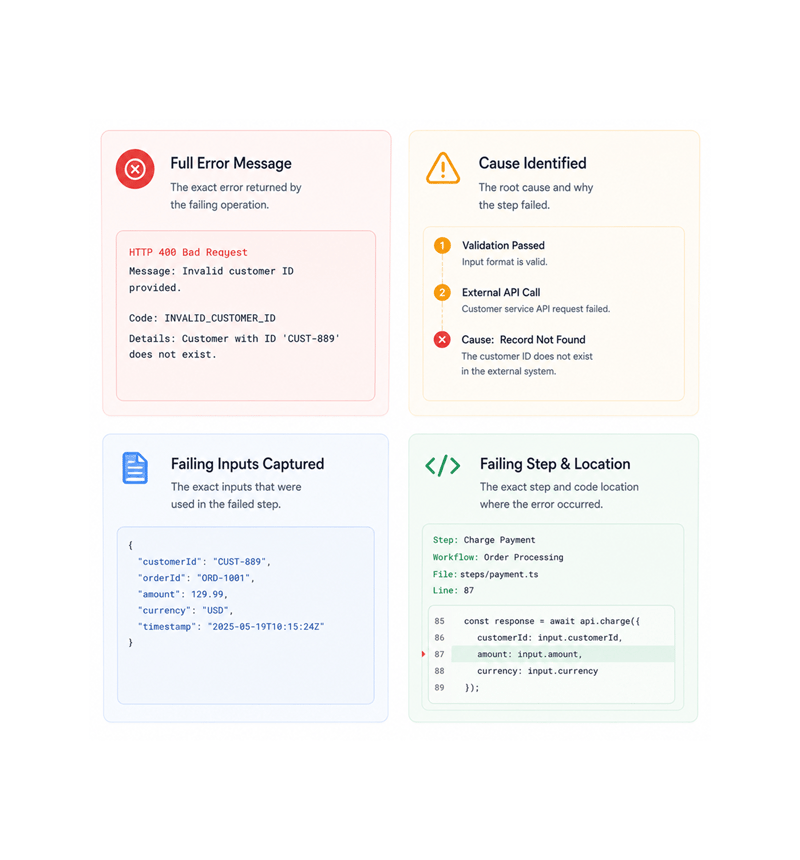
Error Diagnostics
Diagnose errors with full detail
When a step fails, the error appears in the log with full diagnostic detail: the message returned, the cause, the exact step that failed, the input values, and the line where it occurred. The vague "something went wrong" is gone.
- Full Error Message
- Cause Identified
- Failing Inputs Captured
- Inline Panel
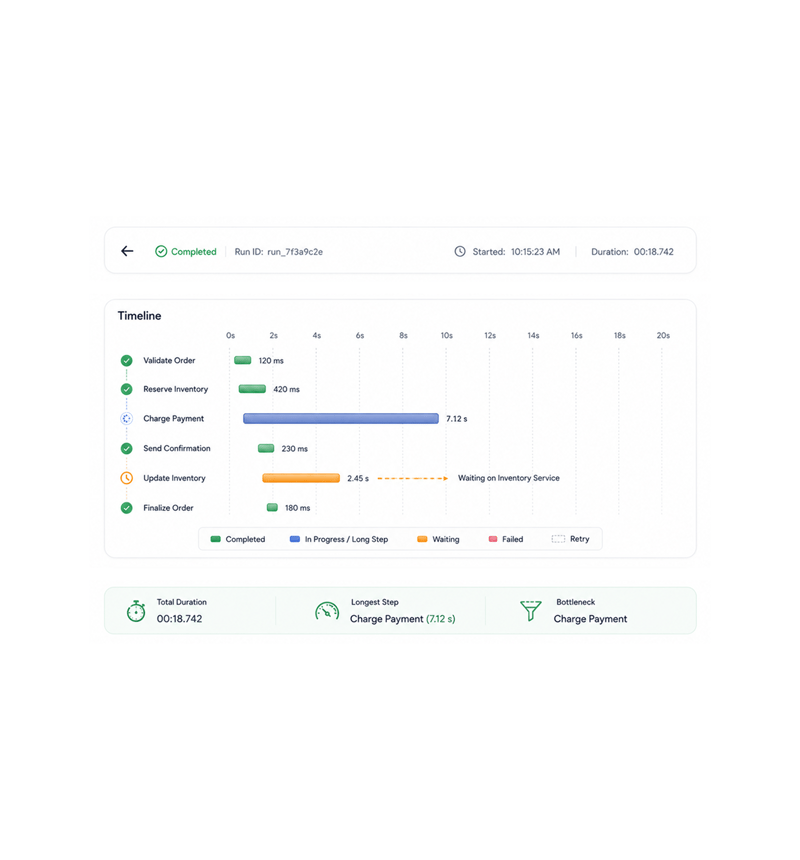
Visual Timeline
Profile every run on the timeline
Every run has a visual timeline showing each step as a horizontal bar with its duration, position, and any retries or waits. The step that takes seven seconds when others take a hundred milliseconds is obvious at a glance.
- Visual Timeline
- Per Step Duration
- Bottlenecks Obvious
- Retries & Waits Visible
Six reasons teams never go back
Once a team sees every run live with step logs and a timeline, hearing it from a customer complaint stops being acceptable.

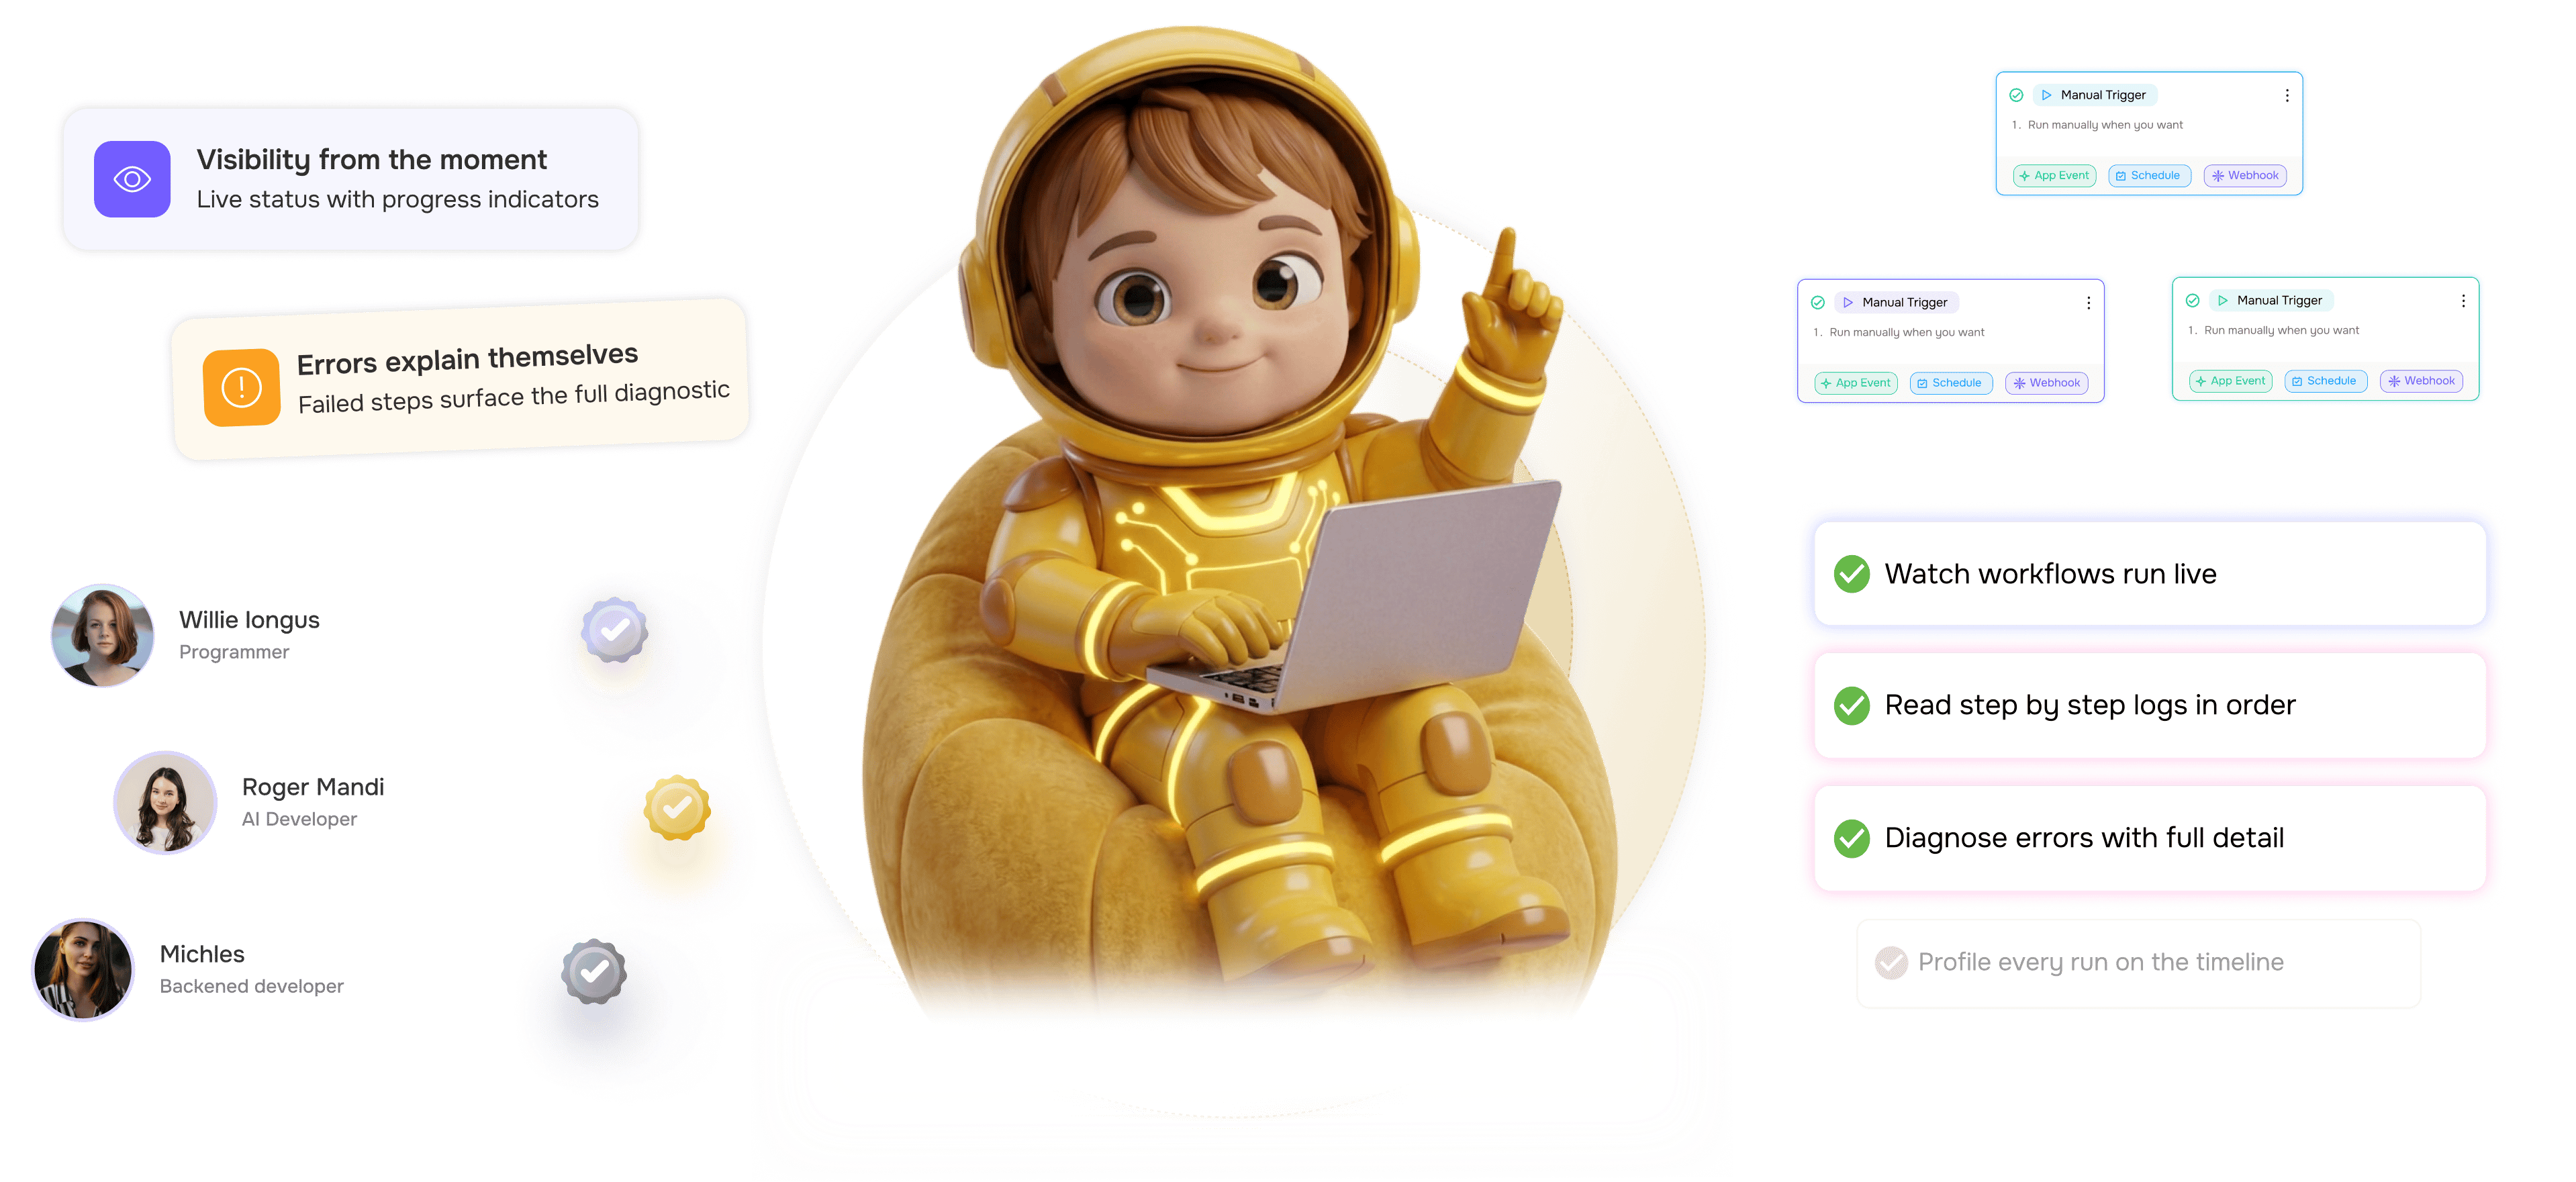
Visibility from the moment a workflow starts
Live status with progress indicators means the team knows exactly what is happening across every running workflow. Each run shows its step, progress, and elapsed time.

Errors explain themselves
Failed steps surface full diagnostic detail in the execution view: the message, cause, inputs, and exact location. "Something went wrong" collapses to one panel.

Bottlenecks become obvious
The visual timeline makes the slow step a long bar next to short ones. The problem that used to need manual timing and ten reruns shows up in the first run.

The full story, not just the headline
The log captures every input, output, decision, and retry, not just the outcome. "Why did this send the wrong email Tuesday" is answered by reading the run.

Debugging becomes a search, not a hunt
Execution history is searchable by workflow name, trigger source, status, date range, error type, and any field in any step. Finding last Tuesday's run is one search.

Compare runs to find what changed
Side by side comparison of two runs makes the difference visible: the input that changed, the step that branched, the duration that grew. "What changed" is built in.
Visibility from the moment a workflow starts
Live status with progress indicators means the team knows exactly what is happening across every running workflow. Each run shows its step, progress, and elapsed time.
Errors explain themselves
Failed steps surface full diagnostic detail in the execution view: the message, cause, inputs, and exact location. "Something went wrong" collapses to one panel.
Bottlenecks become obvious
The visual timeline makes the slow step a long bar next to short ones. The problem that used to need manual timing and ten reruns shows up in the first run.
The full story, not just the headline
The log captures every input, output, decision, and retry, not just the outcome. "Why did this send the wrong email Tuesday" is answered by reading the run.
Debugging becomes a search, not a hunt
Execution history is searchable by workflow name, trigger source, status, date range, error type, and any field in any step. Finding last Tuesday's run is one search.
Compare runs to find what changed
Side by side comparison of two runs makes the difference visible: the input that changed, the step that branched, the duration that grew. "What changed" is built in.


11200+
Teams running workflows with full
execution visibility
Built for teams who automate at scale and need to see everything
Ops leaders, platform teams, automation engineers, and customer success use Revo execution monitoring as the single window into every run. Live status is the real time view, step logs the deep dive.
Status
Logs
Timing
Timeline
Watch every run as it happens
Live status with progress indicators for every running workflow. See which step is executing, how far through it is, and how long it has run. The team always knows what is healthy and what needs attention.
Everything the monitoring layer ships with
A complete visibility toolkit in the platform you use. Live status, logs, error diagnostics, timing, timeline, history.

Live Execution Status
Every running workflow shows its current step, progress, elapsed time, and health in real time. The view auto refreshes as steps complete.

Step by Step Execution Logs
Every run keeps a complete log of every step executed: inputs, outputs, timing, and inline notes. The log reads top to bottom.

Error Diagnostics with Stack Traces
Failed steps surface full error context: message, cause, inputs, location, and stack trace. The vague "something went wrong" collapses to one panel.

Execution Duration Per Step
Every step's duration is captured automatically, including waits, retries, and service round trips. The slow step among fast ones is a glance.

Visual Timeline of Every Run
Every run gets a visual timeline showing each step as a horizontal bar with duration, position, retries, and waits. Slow steps stand out.

Searchable & Filterable Run History
Every run's history is searchable by workflow name, trigger source, status, date range, error type, and any field in any step. Last Tuesday is one search.
Everything you need to know
Questions about live status, step logs, error diagnostics, the timeline, retention, and alerting.
Describe the workflow, Revo builds it across 1,000+ apps.
Write an automation in plain English and Revo connects your tools, then sends AI agents to take action while you sleep.
- 1,000+
- app integrations
- 99.9%
- workflow uptime
- 0
- lines of code to build
- 10x
- faster than manual