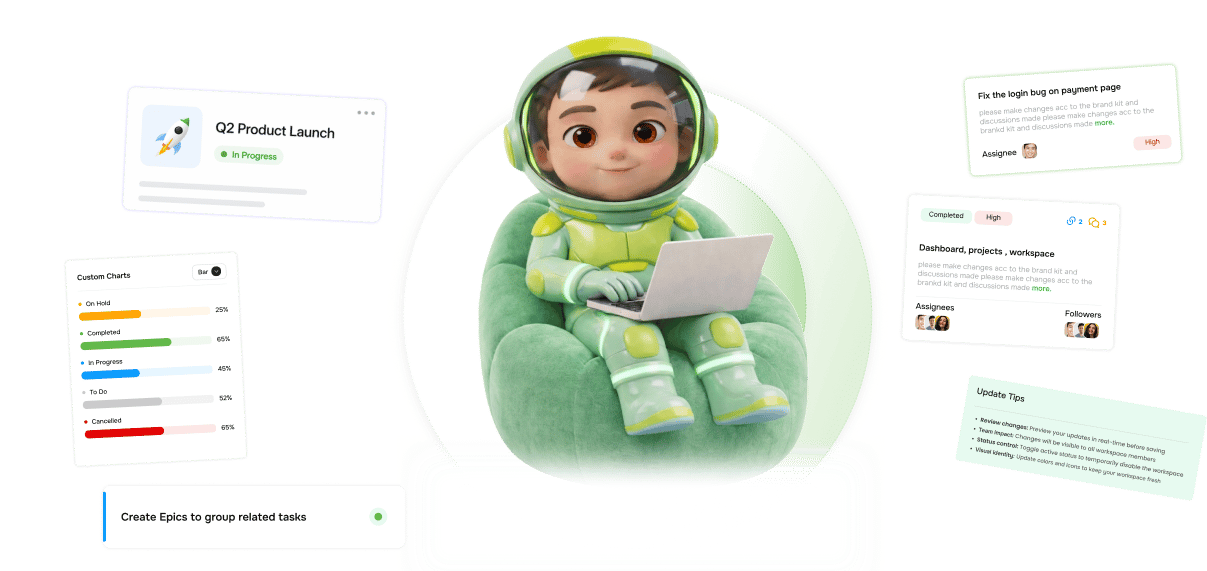
Mood Tracking That Makes Team
Wellbeing Visible Every Day
Daily emoji-based mood logs per team member, plus aggregate analytics with 30-day trends an early signal of burnout before it hits velocity.
From a daily emoji tap to an org wide burnout signal in four steps
TARO makes mood logging frictionless, one tap a day, and aggregates it into team-wellbeing data.
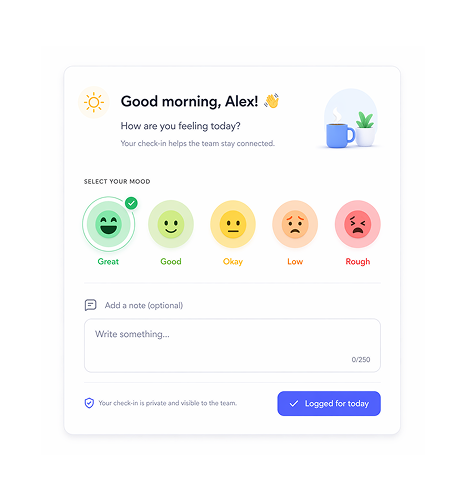
Log
Five moods. One tap. Thirty seconds to log and go.
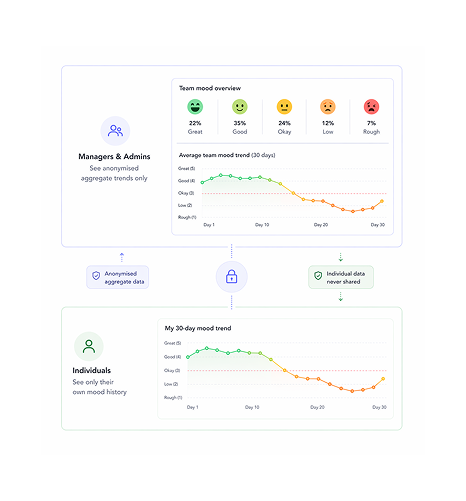
Each morning, every member sees a mood check-in prompt, a gentle nudge on the dashboard, not a popup. Five options map to five levels: Great, Good, Okay, Low, Rough. One tap logs the day, with an optional note.
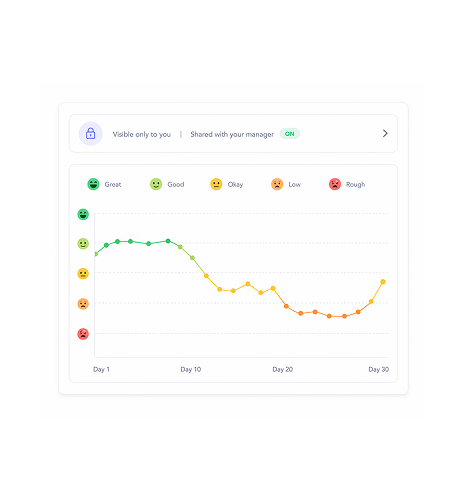
Trend
Your personal 30 day trend shows patterns you might not notice daily.
Each member's personal view shows a 30-day rolling chart of their own moods, making gradual drift visible. Visible only to them, and with opt-in, their direct manager.
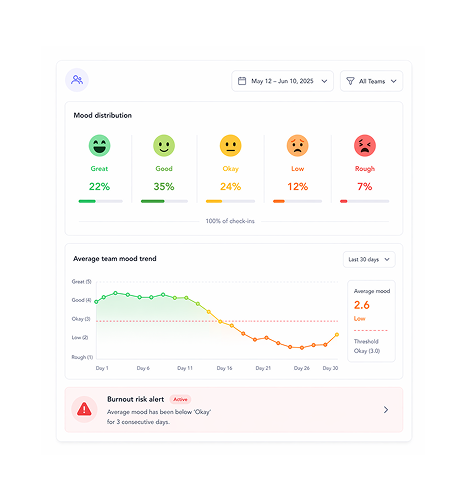
Analyse
Aggregate mood signals reveal what individuals never mention.
Managers and org admins see an aggregated, anonymised view of team mood, the distribution of entries and a 30-day trend line for the average. Burnout signals fire when mood drops below a set threshold.
Privacy
Managers see trends. Never individual entries.
Mood tracking only works if members trust a bad day won't be used against them. TARO enforces this structurally, not by policy: managers and admins access anonymised aggregate data only. Histories stay private.
Six reasons teams never go back
Velocity drops are lagging indicators. Mood trends lead. By the time burnout hits the sprint, it's been in the data for weeks.

Mood is a leading indicator velocity is a lagging one
When a team's average mood drops below Okay for a week, the velocity drop that follows is predictable. TARO surfaces it 10 to 14 days early.

One tap removes the friction that kills daily habits
A five-minute survey nobody completes generates no data. A single emoji tap takes two seconds. Lower friction means higher participation.

Privacy architecture builds the trust that makes logging honest
Members log honestly when they trust the data won't be used against them. Anonymisation is structural, managers cannot access individual entries.

Burnout signal integrates with Risk Alerts Dashboard
When aggregate mood drops below the burnout threshold for three consecutive days, TARO fires a Monitor-severity alert in the Risk Alerts Dashboard.

30 day view reveals drift individuals don't notice day by day
Burnout rarely announces itself. It accumulates gradually, a week of Okay, then Low, then Rough. The 30-day chart makes the slope visible.

Optional notes give context without making logging feel like a report
The note field is genuinely optional, logging an emoji with no note is the default. Notes are for members who want context, not for managers.
Mood is a leading indicator velocity is a lagging one
When a team's average mood drops below Okay for a week, the velocity drop that follows is predictable. TARO surfaces it 10 to 14 days early.
One tap removes the friction that kills daily habits
A five-minute survey nobody completes generates no data. A single emoji tap takes two seconds. Lower friction means higher participation.
Privacy architecture builds the trust that makes logging honest
Members log honestly when they trust the data won't be used against them. Anonymisation is structural, managers cannot access individual entries.
Burnout signal integrates with Risk Alerts Dashboard
When aggregate mood drops below the burnout threshold for three consecutive days, TARO fires a Monitor-severity alert in the Risk Alerts Dashboard.
30 day view reveals drift individuals don't notice day by day
Burnout rarely announces itself. It accumulates gradually, a week of Okay, then Low, then Rough. The 30-day chart makes the slope visible.
Optional notes give context without making logging feel like a report
The note field is genuinely optional, logging an emoji with no note is the default. Notes are for members who want context, not for managers.


800+ product teams
already using TARO
Built for every lead managing
humans through sustained delivery pressure
Engineering leads running multi month delivery programmes and HR leads managing distributed teams need the same thing: an early signal that something is wrong with team wellbeing before it shows up as attrition or a missed sprint.
Mood levels tracked
Day trend window
Individual entries managers can see
Days earlier than velocity
The sprint retrospective says the team felt overwhelmed. Mood tracking said so on day 3.
Leads read the 30-day mood trend alongside the burndown. When delivery is on track but mood is declining, next sprint won't be sustainable. The fix happens on day 5.
Mood shows the human signal. These features show the delivery signal.
Mood trends read best alongside sprint velocity, workload, and risk alerts, the full picture.

Risk Alerts Dashboard
Burnout signals from mood tracking feed directly into the Risk Alerts Dashboard as Monitor-severity alerts, as visible as blocked tasks.

Workload Distribution
When mood declines track one member's workload staying above capacity, Workload Distribution surfaces the reassignments that relieve it.

Sprint & Agile
Sprint planning that uses velocity data and mood trends together makes sustainable commitments not just achievable ones that quietly erode team health.

Analytics & Dashboards
The Team Mood widget shows the live distribution and 7-day aggregate trend in one panel a persistent wellbeing view for leads alongside delivery metrics.
Everything you need to know about Mood Tracking
Common questions from engineering leads, HR teams, and members evaluating TARO's mood tracking.
Taro plans, tracks, and flags risks before they hit.
Keep every project on track with AI that spots slippage early and tells your team what to do next.
- 87%
- on-time delivery
- 2.4x
- team throughput
- 0
- deadlines missed
- 35%
- fewer status meetings